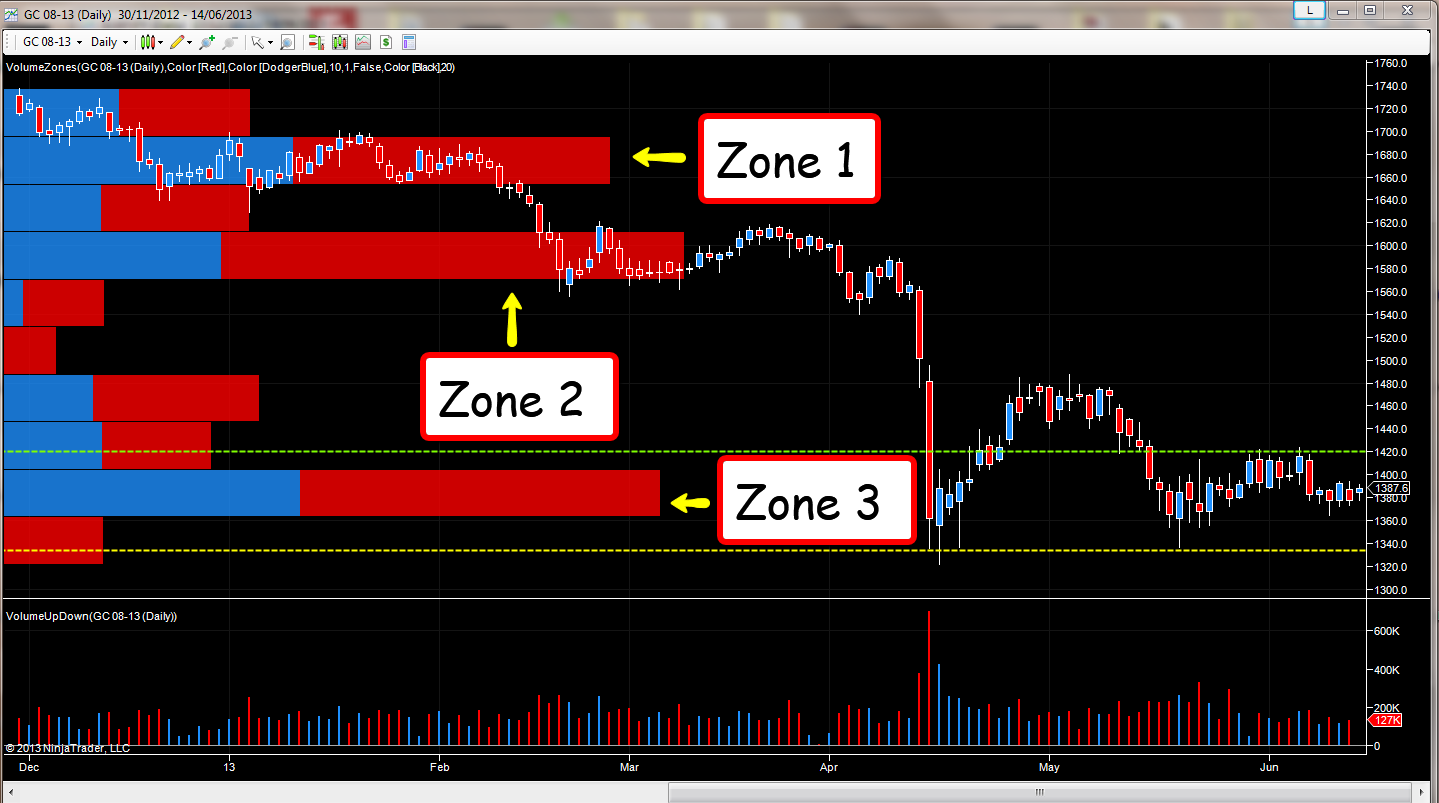
Gold Futures Chart:
I thought it was time to add my analysis for gold, and in particular consider the longer term technical picture, starting with the volume at price zones, which delineate the deep areas of congestion now in place on the daily gold chart.
Zone 1, sits in the heady area of $1660 to $1700 per ounce, a region we are unlikely to see for some time to come, and as you can see, the balance between ‘buying and selling’ or up and down candles is virtually 50/50. This changes dramatically as we move to Zone 2, where the balance has now shifted heavily in favour of the down candles.
This is one of the beauties of volume at price – not only does it reveal congestion zones clearly and simply, but also the balance of up and down candles in that price range, which in turn then gives us a view on the bearish or bullish nature in this region. The $1570 to $1610 per ounce level is clearly weighted with down candles, evidencing the negative sentiment for gold at the time.
Moving to Zone 3, and the current major VAP bar which sits between $1370 per ounce and $1400 per ounce, the balance has now shifted back to the fulcrum point at present, suggesting in itself, that some of the negative sentiment has dissipated from the previous extreme bar in Zone 2. Zone 3 is now key, and this is clearly evident from the current price action, with the upper level of resistance now at $1420 per ounce with the dotted green line, and the lower level of potential support in the $1340 per ounce area and shown with the yellow line.
Last week’s price action followed the same pattern for silver, and as with the industrial metal, the recent USD weakness has failed to provide any momentum for the precious metal. Indeed, even the ‘panic’ selling in equities, has failed to attract flows into this ‘safe haven’ asset. Another example of the breakdown in market relationships which is a feature of price action at present in all markets.
Zone 3, combined with these levels is now the defining area. If and when one of these levels is broken, particularly if it is to the down side, then any recovery for gold will be a long hard road with all these deep areas of price resistance in place overhead. For gold bugs, the picture remains the same, and as with silver, patience is the key for the longer term trader.
TARGETS:BELOW $1300….can see 1250-1150-1000.
-Umesh Shanmugam(purely my view)

