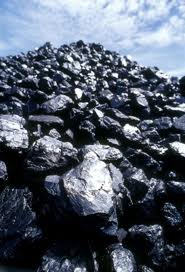
 The estimated demand of coal in the country will reach to 769.69 million tonnes by 2013 -14 against the domestic availability of 614.55 million tonnes. This was stated by the Minister of State for Coal, Shri Pratik Prakash BapuPatil in a written reply in Lok Sabha today.
Shri Patil said that the main factors that constrain production of Coal relate to difficulties in acquisition of land, obtaining environment and forest related clearances, difficult geo mining conditions in some areas. Difficulties in resettlement and rehabilitation as also intermittent law and order problems are also experienced in some mining areas. Another important constraint pertains to coal evacuation capacity particularly through rail movement. Seasonal factors such as excessive rain and heat wave conditions also constrain production. Shri Patil said that as per the current import policy of Government, coal is placed under open general license and can be freely imported by anyone on payment of applicable import duty as per their requirement.
Estimated demand, supply of coal and State-wise production during last three years is as follows: (in million tonnes)
| Year | 2010-11 |
2011-12 |
2012-13(P) |
2013-14(BE) |
| Total demand (Mte) |
656.31 |
696.03 |
772.84 |
769.69 |
| Supply(domestic) (Mte) |
523.465 |
535.299 |
569.767 |
614.55 |
| Production (State wise and total |
|
|
2013-14upto June 2013 |
|
| Andhra Pradesh |
51.333 |
52.211 |
53.190 |
10.400 |
| Arunachal Pradesh |
0.299 |
0.221 |
0.073 |
NA |
| Assam |
1.101 |
0.602 |
0.605 |
0.067 |
| Chhattisgarh |
113.824 |
113.958 |
117.830 |
25.557 |
| Jammu & Kashmir |
0.024 |
0.020 |
0.019 |
NA |
| Jharkhand |
108.949 |
109.566 |
111.203 |
21.527 |
| Madhya Pradesh |
71.104 |
71.123 |
77.278 |
15.653 |
| Maharashtra |
39.336 |
39.159 |
39.003 |
8.720 |
| Meghalaya |
6.974 |
7.206 |
7.137 |
NA |
| Orissa |
102.565 |
105.476 |
110.131 |
23.441 |
| Uttar Pradesh |
15.526 |
16.178 |
14.760 |
3.351 |
| West Bengal |
21.659 |
24.230 |
26.478 |
4.558 |
| Total Production |
532.694 |
539.950 |
557.707 |
113.271 |
Country-wise import of coal, quantity-wise and value during the last three years is given below:
(Quantity in MT and Value in Mn. Rs.)
|
Sl.No. |
|
|
|
||||
|
Country |
Quantity (Mte) |
Value (Rs. Million) |
|||||
|
2010-11 |
2011-12 |
2012-13 |
2010-11 |
2011-12 |
2012-13 |
||
| 1 | INDONESIA |
35.944 |
55.260 |
80.304 |
134788 |
258417 |
321736 |
| 2 | AUSTRALIA |
15.949 |
27.793 |
26.999 |
171194 |
366256 |
282348 |
| 3 | SOUTH AFRICA |
11.214 |
12.217 |
17.641 |
57273 |
77107 |
98371 |
| 4 | U S A |
1.771 |
2.974 |
6.097 |
19829 |
39746 |
52672 |
| 5 | NEW ZEALAND |
0.795 |
0.960 |
0.971 |
7704 |
12986 |
10480 |
| 6 | Others |
3.245 |
3.635 |
5.546 |
24708 |
33864 |
44521 |
| Total Imports |
68.918 |
102.853 |
137.558 |
415496 |
788376 |
810128 |
|
