 As far as we can ascertain, the demand for physical silver is alive and well with reports of people queuing to buy it while a number of suppliers, including the mints have been selling all that they could produce of the popular coins and bars. And yet the price of silver falls in the paper market which highlights the disparity between the physical and paper markets.
The Silver Chart:

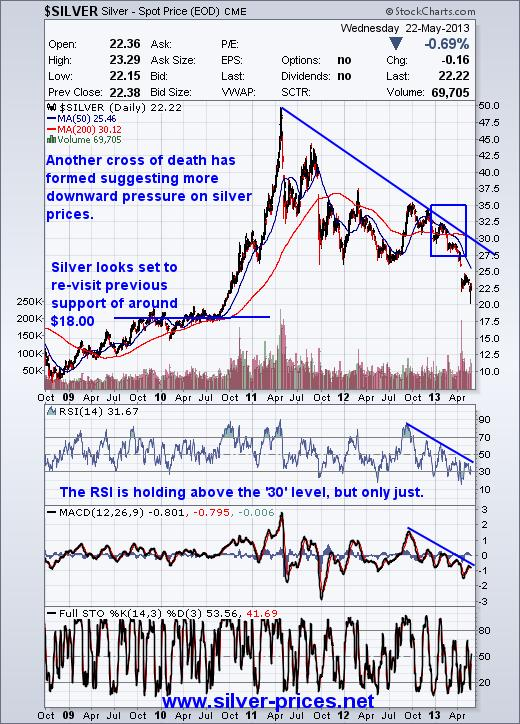
The above chart of silver prices shows that it has been two years since silver flirted with the fifty dollar price level. Since that time it has been a bumpy road on a downward slide. The 200dma and the 50dma have weaved their way lower with a cross of death followed by a golden cross followed by another cross of death. The latest crossover took place at $31.00 and silver has since fallen to today’s level of $22.22/oz.
Although I am of the opinion that we are indeed still in a bull market for silver, the current trend is down and so we have a situation where a short term downtrend exists within a long term uptrend.
I’m not convinced that we have been through a ‘total’ capitulation. This is a capitulation of sorts but there could be more downside before we see any upside movement. The next support level for silver is around the $18.00/oz level and if this current trend continues we could see this level tested before we see a resumption of the rally in silver prices.
-Umesh Shanmugam(purely my view)
